Intuitive interface
The graphical interface is intuitive and easy to use.
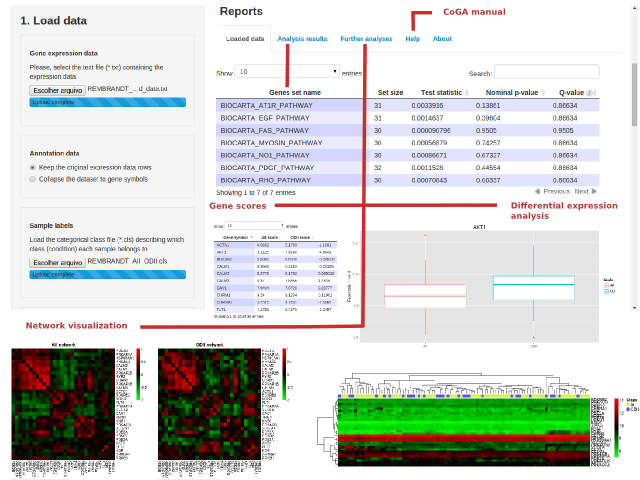
Differential network analysis
Statistical tests to identify differentially co-expressed gene sets between two phenotypes. The analyses are based on the comparison of networks in terms of their topological properties, such as degree and spectrum distributions, centrality, and entropy.
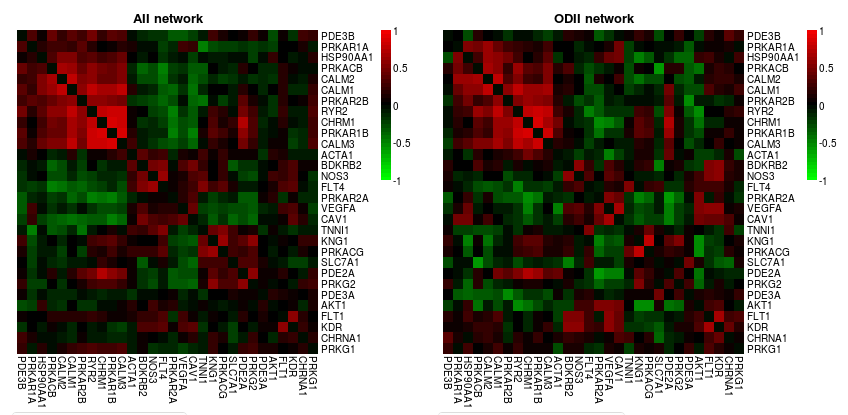
Network visualization
Graphical interface to visually inspect the gene co-expression networks.
Network properties
Network topological properties of each gene set, such us entropy and average centrality.
Gene scores
Ranking of the genes according to their "importance" in the network.
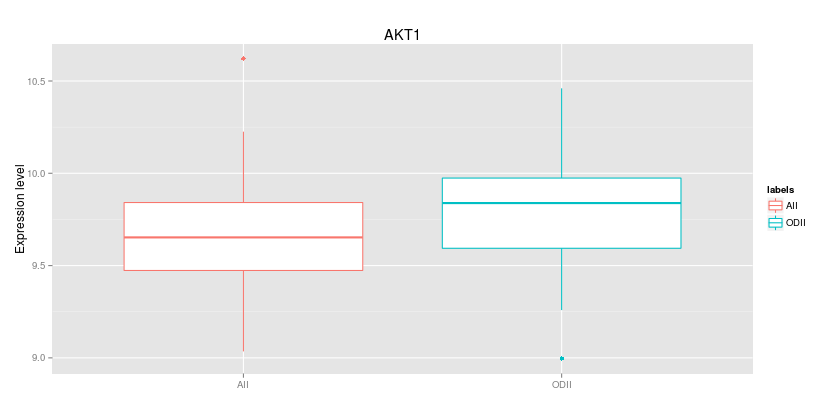
Differential expression analysis
Standard single gene differential analysis. It includes plots (gene expression heatmap and boxplots), and statistical tests (Wilcoxon-Mann-Whitney and t test).
Free to use and open source
CoGA is freely available under the GNU Lesser General Public License (LGPL). Click here to download.