Stereogram Tutorial
Julio M. Otuyama
Introduction
Stereograms are illusions of 3D surfaces. This tutorial shows
how it works, with a simple "do it by yourself" approach. The
random dot stereogram is very easy to understand, although not a
trivial concept. Unlike holograms that require laser beams,
stereograms can be created, printed and visualized with
computers. But it may not be an easy task to see its 3D
surfaces.
Stereo Pairs / Stereograms
Stereo Pairs / stereograms work because the brain can detect
small differences between the images seen by each eye. Stereo
pairs have been studied for a long time - Leonardo da Vinci
almost discovered the concepts of stereo pair visualization. But
only Wheatstone correctly described these concepts. Random dot
stereograms is a very new discovery, developed by Bela Julezs,
during 1970's. Random Dot Stereograms give us a deep impact
because there is an invisible hidden surface.
|
|
|
|
|
|
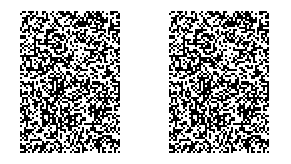
random dot stereogram
Hidden surface: square
|
|
|
Visualization
The visualization of a stereogram requires an unusual skill:
each eye must be targeted to distinct places on the image. This
is unusual to our brains. That is the reason some people hardly
(or can not) see stereograms.
There are two ways to visualize stereograms:
- divergent view
- convergent view
The target of each eye (left and right) is shown:
|
|
|
|
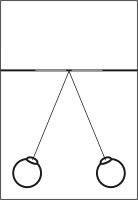
| regular visualization - no stereogram |
|
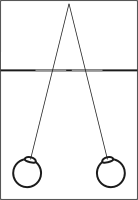
| divergent visualization of a stereogram |
|
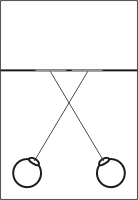
| convergent visualization of a stereogram
(cross) |
|
|
Once one gets the divergent or convergent visualization, he/she
has a clear view of 3D surfaces.
Helper to visualization:
- divergent:
- Eyes relax (infinite focus)
- Transparent media (stereogram on a plastic film)
- convergent:
- Reference point between the eyes and stereogram (put a
pen in the half way from your eyes to the stereogram)
Random Dot Stereogram
Our brain is able to perceive the 3D information of the environment.
The main reason for that are small differences between each eye
image. Both images are captured with a small difference (the
distance between our eyes). This results in very small shifts on
each retina projection image, hard to notice. But although
small, those differences give us the 3D sensation.
Creating a Random Dot Stereogram
The easiest way to learn how a stereogram works is to create
one. Next, the recipe to generate a random dot stereogram
(adapted from Bela Julesz article). There is also a second
approach, based on "ASCII Stereogram". With the ASCII
Stereogram, it is easier to understand the disparity shifts. You
can see both as stereograms, if you have skill enough.
| Steps to generate a stereogram: |
|
|
|
|
|
|
| (a) Create a random dot image |
|
|
ABCDEFGHI
JKLMNOPQR
STUVWXYZ0
123456789
0ZYXWVUTS
RQPONMLKJ
IHGFEDCBA
|
|
| |
|
|
| (b) Duplicate the image and put side by
side |
|
|
ABCDEFGHI ABCDEFGHI
JKLMNOPQR JKLMNOPQR
STUVWXYZ0 STUVWXYZ0
123456789 123456789
0ZYXWVUTS 0ZYXWVUTS
RQPONMLKJ RQPONMLKJ
IHGFEDCBA IHGFEDCBA
|
|
| (c) Select a piece of one image |
|
|
ABCDEFGHI ABCDEFGHI
JKLMNOPQR JKLMNOPQR
STUVWXYZ0 STUVWXYZ0
123456789 123456789
0ZYXWVUTS 0ZYXWVUTS
RQPONMLKJ RQPONMLKJ
IHGFEDCBA IHGFEDCBA
|
|
| (d) Horizontal shift of this piece of image |
|
|
ABCDEFGHI ABCDEFGHI
JKLMNOPQR JKLMNOPQR
STUVWXYZ0 STVWXXYZ0
123456789 124566789
0ZYXWVUTS 0ZXWVVUTS
RQPONMLKJ RQPONMLKJ
IHGFEDCBA IHGFEDCBA
|
|
|
|
| The hidden image is the piece shifted |
|
|
ABCDEFGHI ABCDEFGHI
JKLMNOPQR JKLMNOPQR
STUVWXYZ0 STVWXXYZ0
123456789 124566789
0ZYXWVUTS 0ZXWVVUTS
RQPONMLKJ RQPONMLKJ
IHGFEDCBA IHGFEDCBA
|
|
|
Convergent/Divergent view and disparity
With a divergent view, the shifted square appears as
floating (nearer than everything else). With a convergent
view the shifted square appears as a hole (farther
than everything else).
Disparity is the concept that explains why we get the 3D
perception of the nearer and the farther distance. This concept
can be explained with "ASCII Stereogram". Let's call disparity
as the number of letters to to go from a letter in the left pair
to its counterpart at the right pair. For instance, from the
first letter "A" of the left pair takes 10 letters
of disparity to reach its counterpart in the right pair:
ABCDEFGHI A
^123456789^
On the (b) step, all the letters have the same disparity (it is
only a flat surface).
The shift on step (d) changes the disparity. For instance, the
letter "V" now takes 9 letters of
disparity to reach its counterpart in the right pair:
VWXYZ0 STV
^12345678^
With a divergent view this means that our eyes have to "move a
little" to perceive this as the same letter by both eyes. The
"movement" required is the right eye to move a little toward the
left, just like we were seeing things nearer. That is why this
letter is perceived as nearer than the background. As a matter
of fact, our eyes don't move, but the image projected on the
retina causes this effect, and our brain is able to detect this.
Now we can make a relationship of shifts and disparity:
| |
Left Pair |
Right Pair |
| Increase Disparity |
Shift to Left |
Shift to Right |
| Decrease Disparity |
Shift to Right |
Shift to Left |
And a relationship of disparity and divergent/convergent view:
| |
Smaller Disparity
|
Larger Disparity
|
|
Divergent View
|
Float Near
|
Float Far
|
|
Convergent View
|
Float Far
|
Float Near
|
The disparity causes inverse effects with divergent versus
convergent views because of the cross in the convergent view.
Try it (MS Windows 3.x/95/98/me/NT/2000/XP/2003/Vista/7/8/10)!
This lab can be done on your computer in a few moments. No extra
software is required.
This description is based on MS Windows / IE, but it's easy to
adapt to Apple Mac, Linux, etc.
| Steps to generate a Stereogram: |
|
|
|
| Save this image on your
computer: |
 |
|
|
|
|
|
Open the image with an image edition
tool (Paint, Paintbrush, Photoshop, etc)
|
|
|
|
|
Select a small piece of one image with
the selection tool (usually the dotted
square)
|
|
|
|
| Shift the selection (horizontal shift only) |
|
|
The resulting image is a random dot
stereogram made by you!
Hint: you can select any kind of shape,
even letters (yes, your name!). But the
shape must be large enough for our brain
to detect it.
|
|
|
SIRDS - Single Image Random Dot Stereogram
The Random Dot Stereogram is a scientific proof (see below),
but what made this concept widely known was the illustrations
called SIRDS (books like Magic Eye, CG Stereogram, etc). To
create a SIRDS, you have to put not two, but a repeating pattern
of random dots, and make shifts to get the desired effect.
Instead of black and white random dot patterns, you can use a
colored pattern to fill the repetition. To create complex
surfaces there are computer algorithms that copy the pattern
side by side based on grayscale disparity maps.
The easiest way to create stereograms with complex surfaces is
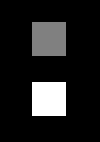
to use grayscale disparity maps. The grayscale disparity map is
a representation of some surface with each gray tone associated
with a distance. For instance, you could create a background black
disparity map, with a floating square near, represented by a
white square. To create a random dot stereogram based on this
disparity map, you have to copy (or copy and shift) the random
dot pattern based on the corresponding coordinate content color
in the disparity map. When the color is black, just copy the
pixel to the other image. If the color is white, copy the pixel
to the other image and shift it. The figure below illustrates
this procedure. This is almost the same random dot stereogram
presented previously.
|
Grayscale disparity map (only one
cycle)
|
|
|
|
|
The disparity map associates gray tones
to distances:
- black - background distance
- gray and white - floating squares at
different distances
|
|
|
|
|
Copy the pixel based on the
corresponding coordinate content color
of disparity map:
- copy pixel with no shift if the
disparity map content is black
- copy pixel with small shift if the
disparity map content is gray
- copy pixel with large shift if the
disparity map content is white
|
|
|
|
|
Result: Random Dot Stereogram
- black: background
- gray square: small disparity
- white square: large disparity
|
|
|
Creating a SIRDS
Now we can create a generic SIRDS with a (not so) complex
surface. There are many cycles to compose the SIRDS because one
cycle requires the pattern from the previous cycle. That is the
reason SIRDS requires computer programs to generate. It is a
difficult task to copy the pattern based on the disparity map,
and this copy requires data only available after the computation
of each cycle. Sometimes there are holes with no pattern after
cycle copy, that requires artificial filling with extra
patterns. Sometimes the same pattern is copied many times at
very close pixels, creating an (undesirable) visual clue of the
hidden surface. As a matter of fact, a computer program doesn't
need to implement the cycles, just copy a non-transparent pixel
to another pixel as many times as is required. The cycle is just
a consequence of the procedure.
This procedure shows a black (no shift) and white (shift) copy.
With a general grayscale disparity map, the shift can be small
or big, based on how black or white the gray tone is. Usually
the image is processed with higher resolution than the original,
to achieve a sub pixel shift accuracy.
|
Grayscale disparity map
(many cycles)
|
|
|
|
|
|
|
|
|
|
|
|
|
|
|
Someone could try to move the whole white selection with just
one shift, avoiding the cycles. It wouldn't work because the
disparity of the background and the whole selection is the same.
There is another approach to generate SIRDS, with an algorithm
based on ray tracing concepts. The result is almost the same,
with no visible differences, but it takes a lot more computer
resources. Yes, I did implement a ray tracing algorithm to
create stereograms - because at that time there was no
information of how stereograms worked, and I had no idea who
developed those illustrations (there was no stereogram books
yet; I could only get a copy from an anonymous copy (of a copy)
of a one page stereogram illustration). Everybody was amazed
with that illusion. I was learning C programming language during
my under graduation, so the ray tracing stereogram program was a
good exercise. Later I found information about Bela Julesz and
random dot stereograms.
An interesting illusion
The random dot stereogram is described in the "Foundations of
Cyclopean Perception" article of Bela Julesz. This article is
not about entertainment, but a scientific procedure to show how
our brain works. In this article Bela Julesz shows that with the
random dot stereogram:
- Random dot stereogram pair conveys information that is lost
with only one image presentation.
- Each image does not have any clue about 3D information
(shape from shade, contours, etc);
- Our brain is able to extract the 3D information from a
random dot stereogram (you just need to visualize it).
So, this shows that:
- There is 3D information detection from the horizontal shifts
(brain stereopsis skill);
- This 3D information can not be detected at retina stage;
- Detection happens somewhere that receives information from
both eyes (binocular stage).
Stereogram Gallery
Images: Flag
of Brazil, Wine
Glass, Rings,
USP, Pigeons, Birds, Half
Sphere, Helicoid
Flash animation: Hanabi
Stereogram
QR Stereo Code
HTML5: Generate SIRDS
online
External Links
Foundations of Cyclopean Perception - Bela
Julesz
Book Eye, Brain and Vision (EBV) from David
Hubel. That is a good introduction to human vision from a
neuro-scientist. It is a scientific book, but it is very easy to
read.
Stereogram,
Autostereogram,
Christopher
Tyler
Back to home page