Covid-19 - Forecasts
Time series research group:
Pedro Morettin, Airlane P. Alencar, Chang Chiann, Clelia Toloi – IME-USP
Francisco M. M. Rocha – UNIFESP, Kim Samejima – UFBA, Marcelo Taddeo – UFBA, Michel Montoril – UFSCar
Main Goal: Forecast the cumulative number of confirmed cases and deaths in São Paulo and in Brazil and the reproduction number using time series tecniques.
These forecasts will be updated next week, including new data.
Data source: https://covid.saude.gov.br/.
1. Model for the Reproduction Number of the COVID-19 Pandemic Outbreak
Michel H. Montoril – UFScar
Chang Chiann – IME-USP
Pedro A. Morettin – IME-USP
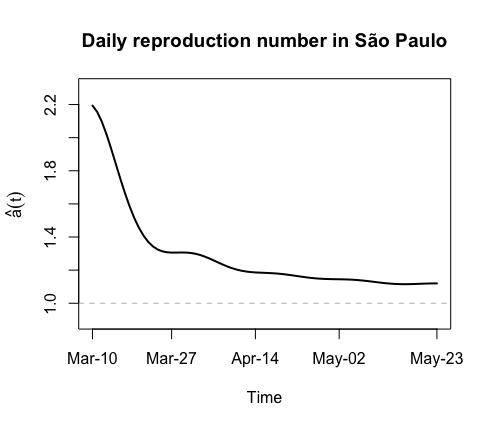
The following model deals with the estimation of the reproduction number,
where we consider the dynamic time varying heteroscedastic exponential model
![]()
The
peak of the curve will be reach when
![]() .
.
Figure: Estimated Dynamic Reproduction Number in São Paulo
2. Nonlinear regression models
Francisco Marcelo M. da Rocha
Data from Mar, 1st to July, 25th.
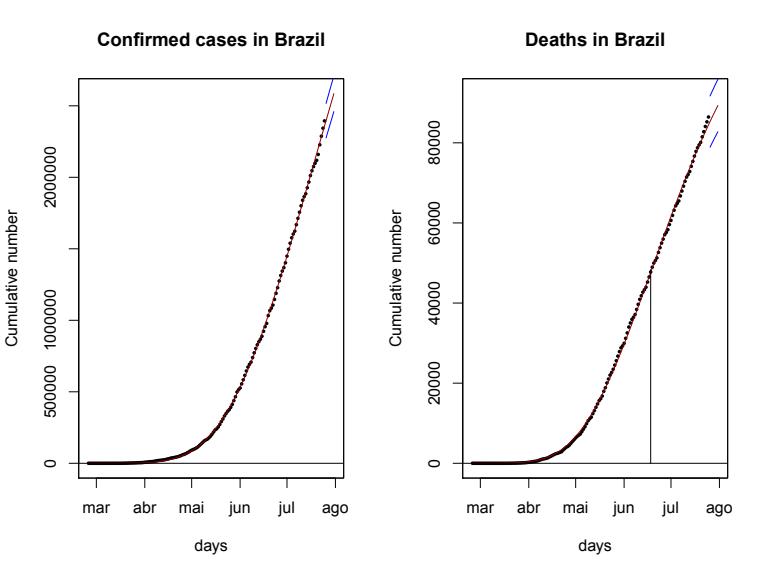
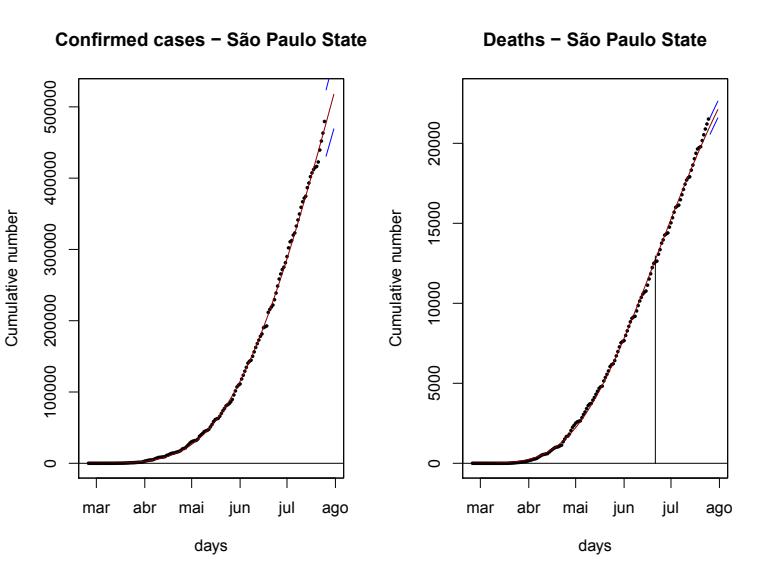
The cumulative number of confirmed cases and deaths suggests a exponential growth, but we observe an exponentially decreasing growth coefficient.
This behaviour suggests that the Gompertz distribution is appropriate for the growth of the number of cases and deaths. We also present the forecasts using this distribution.
Figure 1: Cumulative number of confirmed cases and deaths
The daily number of confirmed cases and deaths may also be forecast assuming the this model is still valid in the future as shown in the next figure.
Our results concludes that this pandemic will last until the end of the year maintaining the current conditions.
Figure 3. Daily number of confirmed cases and deaths in Brazil and SP with forecasts.
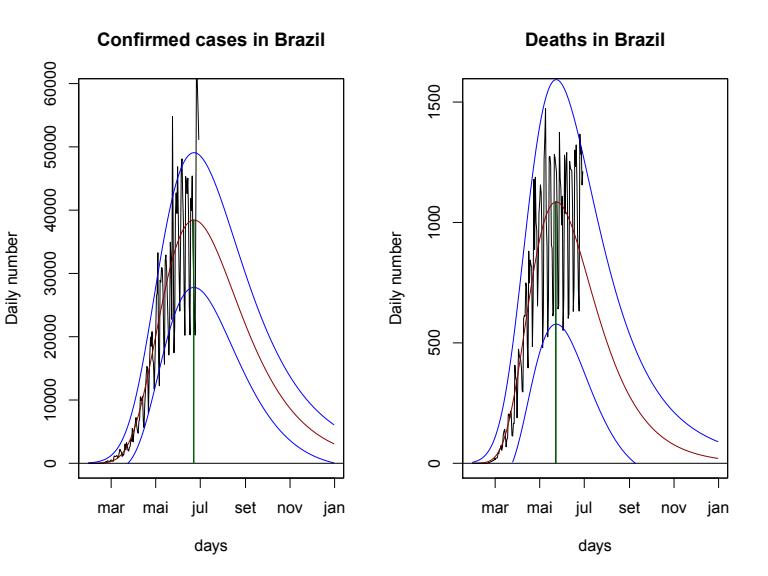
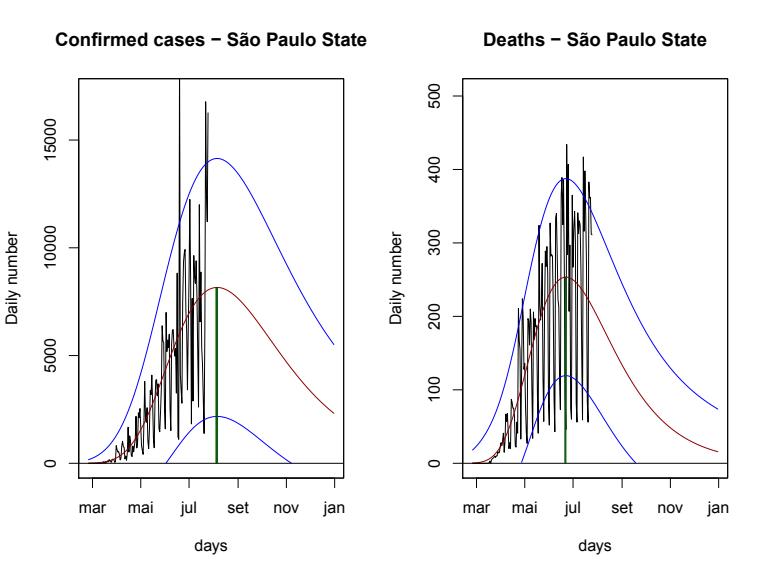
Table 1: Forecasts of the cumulative mean number of cases and deaths in Brazil and São Paulo state until July 31th.
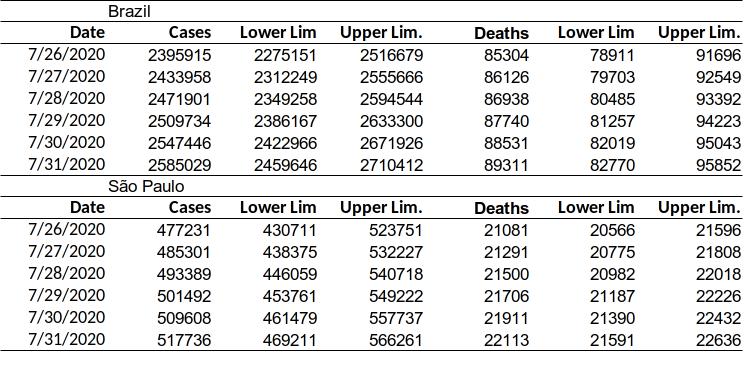
Table 2: Daily mean number of cases and deaths in Brazil and São Paulo state until July 31th.
3. ARIMA model
Airlane P. Alencar
ARIMA models were fitted for data from Mar, 1st to July, 18th and we calculated forecasts of the number of cases and deaths for the next 13 days (until July 31th), including 95% confidence intervals. The series behave as random walks and it is better to calculate only short-term forecasts.
The models were estimated maximizing the likelihood and the models were chosen minimizing the Akaike’s criterion in order to obtain the best fit avoiding the excessive increase of the number of parameters. A residual analysis was performed to verify the validity of model assumptions. The variance of the residuals were smaller in the beginning of the considered period.
São Paulo State
Forecasts – São Paulo State
The number of cases increases 19% and the number of deaths increases 17%.
In May, these numbers increased 55% in two weeks.
Brazil
Forecasts - Brazil
Increases of 19% and 17% respectively in the number of confirmed cases and deaths in Brazil.
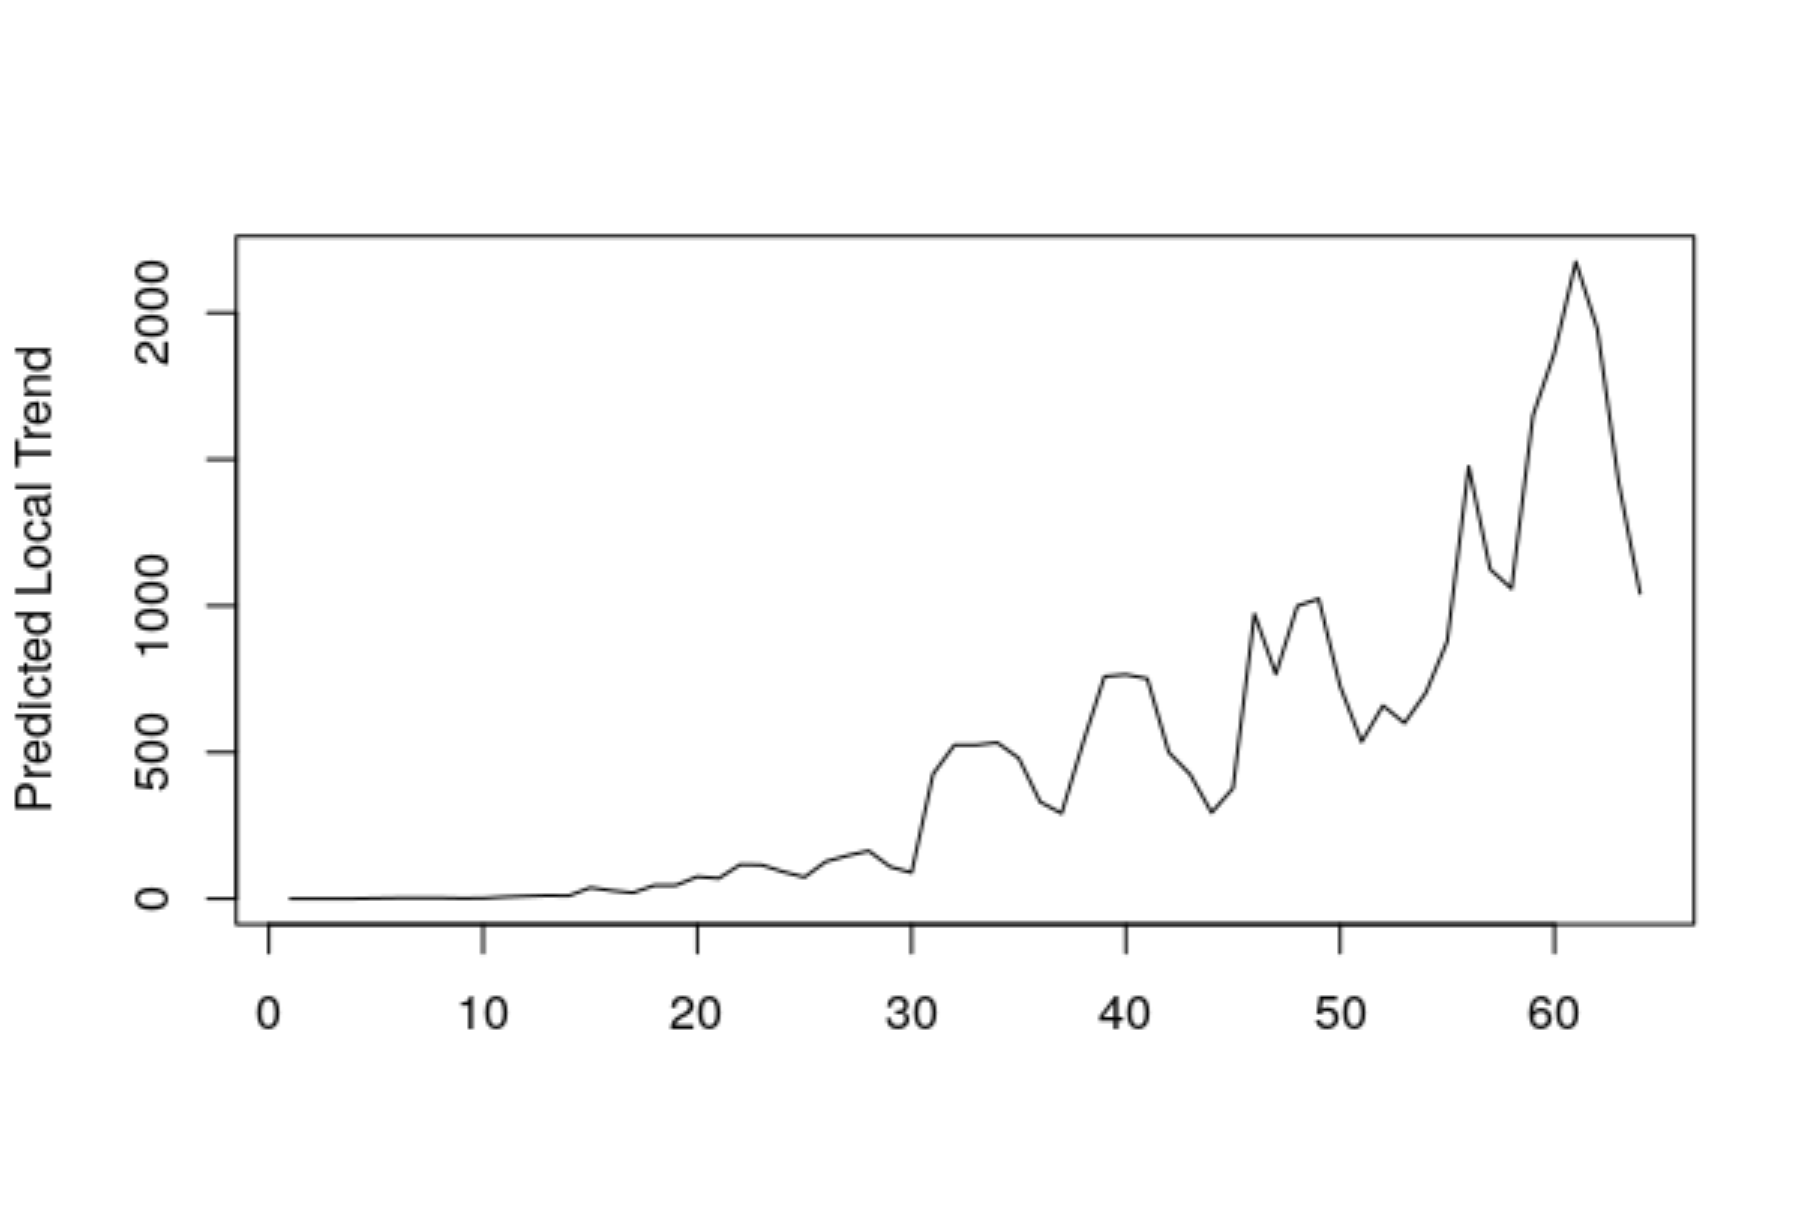
4. Local trend model
This
model assumes that the level,![]() , is
a random walk and changes with slope
, is
a random walk and changes with slope
![]() ,
that is another random walk.
,
that is another random walk.
The number of cases are similar to the ARIMA forecasts (SP until May 3rd).
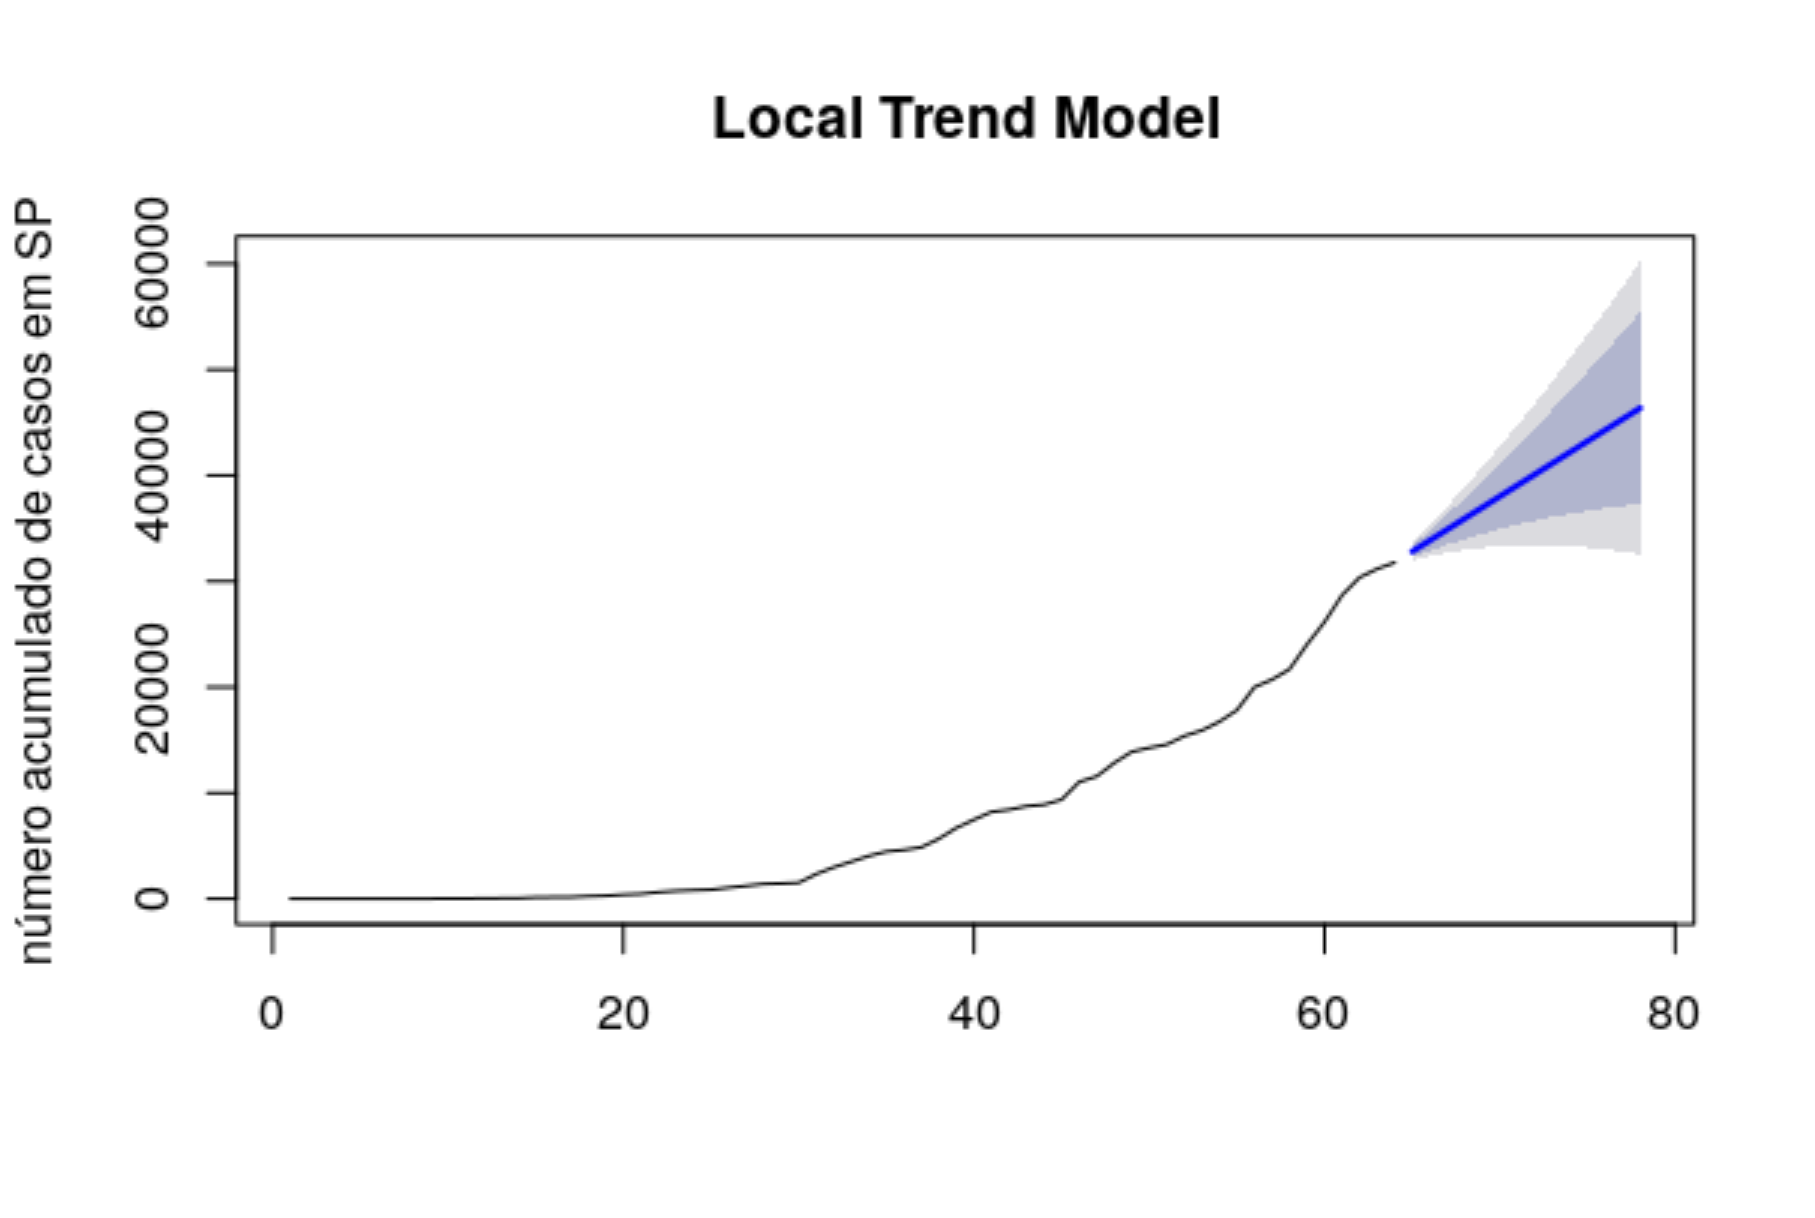
The predicted local trend is increasing.